A Metal That Never Stops Reacting to the World Around It
Because it responds to two very different sets of forces simultaneously, silver has an interesting place in the financial world. On the one hand, it works similarly to a financial object that buyers purchase to guard against inflation or shaky economic conditions. However, it serves as an industrial raw material that is used in huge amounts by makers of solar panels, computer parts, 5G equipment, and electric vehicle components. Because of its dual nature, silver prices are rarely stable. A central bank statement in Washington, a mining disturbance in Peru, or a rise in orders for solar panels from Chinese makers can all cause price changes in a single business day. Knowing how to read daily price changes is important for anyone with money involved in this metal, whether through real stocks, exchange-traded funds, or futures contracts on the Multi Commodity Exchange. It is important.
Where the Numbers Come From and What They Actually Represent
The amount that shows on a financial site when someone looks up the cost of silver today has already passed through multiple levels of calculations. The trip starts at global standards set up on the London Bullion Market and COMEX in New York, where live prices are quoted in US dollars per troy ounce. Even when global silver prices stay the same, currency changes between the dollar and rupee directly affect what Indian customers pay since those dollar amounts are then turned into Indian rupees based on the current exchange rate. After conversion, domestic factors add further adjustments.
Import duties currently hovering around 10.75 percent, a three percent goods and services tax, and local supply and demand conditions all contribute to the final number. The standardized purity benchmark for investment grade silver in India is 99.9 percent fineness, verified through BIS hallmarking. Understanding this chain of price formation helps an observer distinguish between a genuine shift in silver’s global value and a movement caused purely by currency fluctuations or tax policy changes.
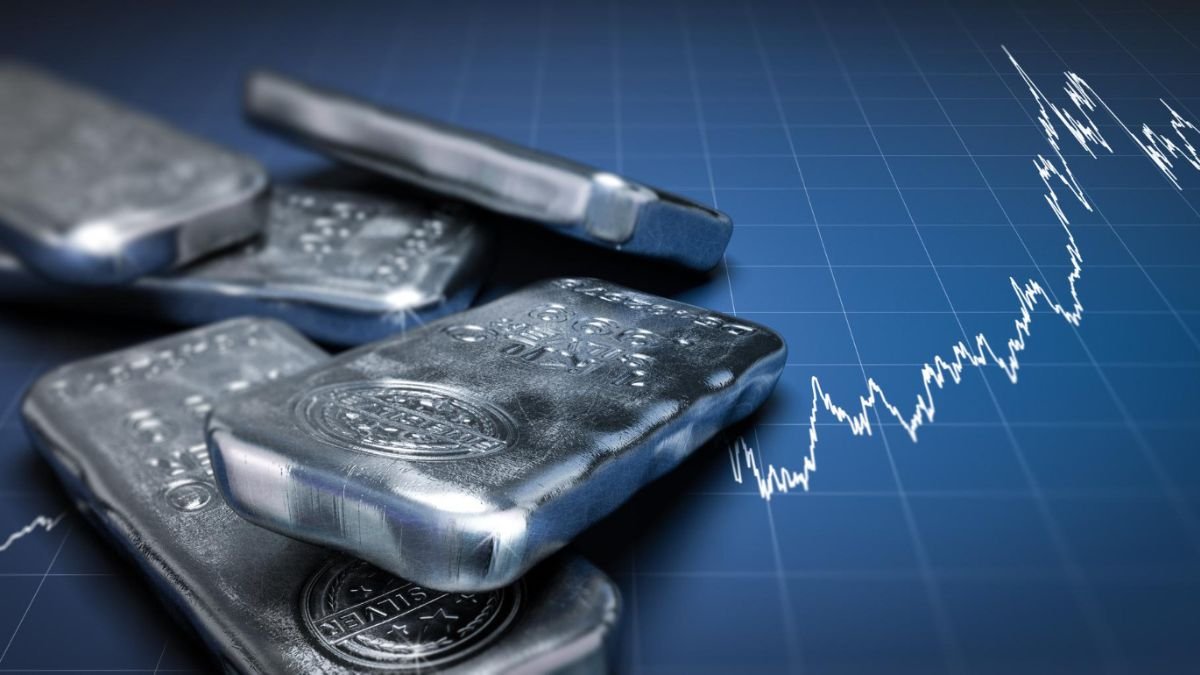
Reading Patterns Instead of Reacting to Individual Numbers
Isolated daily prices tell only a small part of the story. The real insight comes from studying how those numbers connect across weeks and months. A silver price chart plotted over a meaningful timeframe reveals trends that single day figures cannot communicate. Technical measures such as Bollinger Bands, the Relative Strength Index, and moving average convergence divergence are used by traders on MCX to determine if a certain price movement is the start of a long-term trend or just a temporary change that will fix itself in a few days. An extra layer of research is supplied by inventory data from foreign stores. While rising stocks indicate possible excess and downward pressure, dropping stores indicate tighter supply conditions that may support future price rises.
Building a Habit Rather Than Chasing a Number
Tracking silver effectively requires consistency rather than occasional curiosity. The investors and traders who develop the deepest understanding of this market are the ones who check data daily, compare domestic rates against international benchmarks regularly, and study historical patterns before making decisions rather than reacting impulsively to a single morning’s headline.
Also Read: A 10-Minute Guide to Instant Crypto: Moving From Coins to Cash